
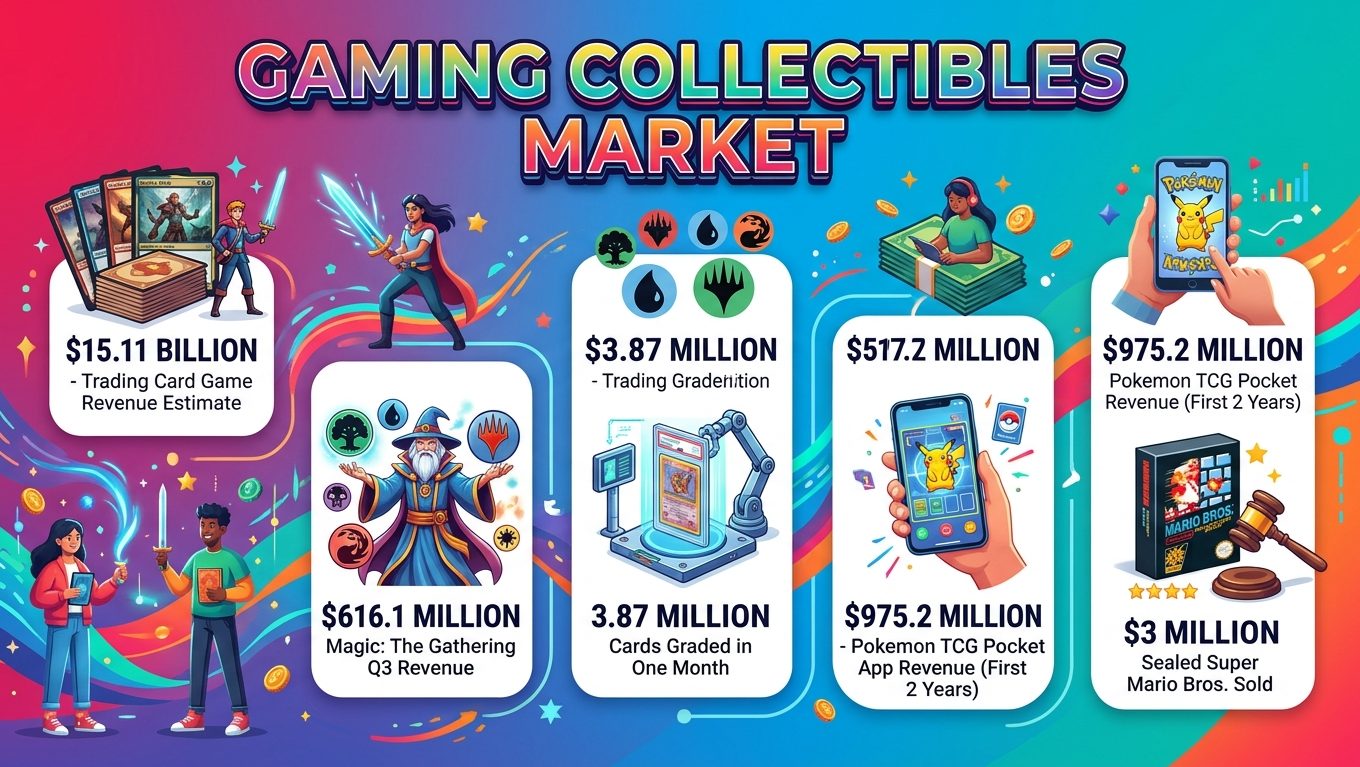
Magic: The Gathering brought Hasbro $616.1 million in the third quarter of 2026. Graders processed 3.87 million cards in October 2026, excluding Beckett.
This page covers how research firms size the gaming collectibles market, which companies report the most card-driven revenue, grading and buyer data, sealed-game auction records and Pokemon TCG Pocket spending.
Gaming Collectibles Market: Key Figures for 2026
How Big Is the Gaming Collectibles Market in 2026?
No research firm publishes one figure for the whole gaming collectibles market. Trading card games are the largest segment with a published size.
Mordor Intelligence estimates trading card game revenue at $15.11 billion in 2026, up from $13.28 billion in 2025. Its forecast reaches $24.36 billion by 2031, a 10.03% CAGR over 2026 to 2031.
Source: Mordor Intelligence, Trading Card Game Market report, 2026-2031 edition (page updated September 11, 2026)
Scope explains most of the gap between estimates. Mordor counts gameplay-linked card revenue, physical and digital, and leaves out memorabilia cards with no game rules.
Global Market Insights uses a different scope. It puts trading card games at $9.2 billion in 2026 and $16.9 billion by 2035, a 6.9% CAGR.
Source: Global Market Insights, Trading Card Games Market report, 2026-2035 forecast
Publisher print runs and revenue are broken out in our trading card game market statistics.
Trading Card Game Market Share by Segment and Region
| Dimension | Largest segment (2025 share) | Fastest-growing segment (CAGR to 2031) |
|---|---|---|
| Card type | Character cards (60.78%) | Autograph cards (11.65%) |
| Application | Non-sports games (64.43%) | Sports games (11.23%) |
| Region | Asia-Pacific (46.56%) | Asia-Pacific (11.04%) |
Source: Mordor Intelligence, Trading Card Game Market report, 2025 shares and 2026-2031 forecast
North America held 26.94% of trading card game revenue in 2025. Asia-Pacific held 46.56%.
Source: Mordor Intelligence, Trading Card Game Market report, 2025
$616.1 Million in One Quarter: Magic: The Gathering Leads Hasbro
Magic: The Gathering passed $600 million in quarterly revenue for the first time in Q3 2026. Hasbro reported $616.1 million for the quarter ended September 27, 2026, up 34%.
Nine-month Magic revenue reached $1,630.9 million, against $1,217.7 million a year earlier. Hasbro credited The Hobbit and Reality Fracture sets for third-quarter growth.
The Wizards of the Coast and Digital Gaming segment posted $747.2 million in Q3 revenue, up 31%, at a 49.2% operating margin.
Source: Hasbro, Q3 2026 financial results, quarter and nine months ended September 27, 2026
Full-year 2025 set the base. Segment revenue rose 44.7% to $2,186.9 million, and Magic revenue grew by $638.2 million on Universes Beyond sets such as Final Fantasy and Avatar: The Last Airbender.
Source: Hasbro Form 10-K, fiscal year ended December 28, 2025
Online play for the franchise is tracked in this MTG Arena player count.
Gaming Collectibles Market Leaders in Japan
Japan’s domestic card game and trading card market reached 338.4 billion yen in fiscal 2025. That is about three times the 113.3 billion yen recorded in fiscal 2019.
Source: Japan Toy Association, FY2025 and FY2020 Domestic Toy Market Size reports, via JTB Tourism Research and Consulting
Ruling Liberal Democratic Party lawmakers announced plans in July 2026 for a parliamentary group on the card trade. The group cites fakes, fraudulent sales and money laundering through card deals.
Source: SoraNews24, July 22, 2026; South China Morning Post, 2026
The Pokemon Company
| Metric | FY ended Feb 2025 | FY ended Feb 2026 | Change |
|---|---|---|---|
| Net sales | 410,932 million yen | 531,428 million yen | +29.3% |
| Operating profit | 100,749 million yen | 143,972 million yen | +43.0% |
| Net profit | 70,343 million yen | 120,056 million yen | +70.7% |
Source: The Pokemon Company financial statements in Japan’s Kanpo government gazette, via Serkan Toto and Automaton, fiscal years ended February 2025 and February 2026
These totals include video games and licensing, not cards alone. The company printed about 10 billion cards from April 2025 to March 2026, taking lifetime output past 85 billion.
Source: The Pokemon Company production figures, via PokeGuardian, as of March 31, 2026
Bandai Namco Toys and Hobby
Toys and Hobby sales reached 673.9 billion yen in the year to March 2026, up 12.9%. Segment profit was 126.9 billion yen, an 18.8% margin.
The segment covers Gunpla model kits, capsule toys and confectionery as well as card games. Bandai Namco’s published plan for the year to March 2027 is 690.0 billion yen.
Source: Bandai Namco Holdings, results presentation for the fiscal year ended March 31, 2026 (May 13, 2026)
IP-level sales and segment history sit in these Bandai Namco statistics.
Konami Digital Entertainment
Digital Entertainment revenue was 370,950 million yen in the year to March 2026, up 21.5%. The segment includes Yu-Gi-Oh! cards alongside eFootball and other games.
April to September 2026 revenue reached 243,521 million yen, up 44.3% year over year.
Source: Konami Group, results for the fiscal year ended March 31, 2026 (May 8, 2026) and first half ended September 30, 2026
How Many Cards Are Graded Each Year?
Major graders processed 26.8 million cards in 2025, up 32% from 20 million in 2024, according to GemRate data.
PSA graded 19.26 million cards, up 26%. CGC graded 4.92 million, SGC 1.42 million, Beckett more than 824,000 and TAG more than 440,000.
Source: cllct and Sports Illustrated, citing GemRate, calendar 2025
PSA’s share included 76% of sports cards and 69% of TCG cards graded in 2025.
Source: cllct, citing GemRate, calendar 2025
Monthly Grading Volume in 2026
October 2026 reached 3.87 million cards across PSA, CGC, SGC and TAG, up 20% from September and 48% year over year. Beckett is not in that count.
PSA graded 2.79 million and CGC 966,000, both records in GemRate’s data.
Source: GemRate, October 2026 Grading Recap, published November 1, 2026
Trading cards already led in 2025. TCG and non-sport cards made up 7.2 million of the 12.4 million cards graded in the first half of that year.
Source: cllct, citing GemRate, January to June 2025
Adult Buyers Behind the Gaming Collectibles Market
U.S. toy dollar sales rose 17% in the first half of 2026, the strongest first half in six years, per Circana. Trading cards, collectibles and licensed products led the gain.
| U.S. toy metric | Change, H1 2026 vs H1 2025 |
|---|---|
| Dollar sales | +17% |
| Unit sales | +12% |
| Average selling price | +4% |
| Licensed toy sales | +24% |
| Sales for adults 18+ | +25% |
| Sales for teens 12-17 | +33% |
| Sales to adult-only households | +16% |
Source: Circana, U.S. toy industry report, January to June 2026 (released August 12, 2026)
Adult-only households accounted for 55% of toy sales. Teens and adults together generated nearly 60% of incremental dollar gains.
Source: Circana, January to June 2026
Collecting, not play, drives much of this. In Circana’s March 2025 survey, 19% of U.S. adults had bought Pokemon cards for themselves in the prior six months, and only a quarter of those buyers play the game.
Source: Circana, March 2025 Omnibus Survey
Age-group splits for game purchases are in these gamer spending by generation figures.
A $3 Million Super Mario Bros. Tops the Retro Gaming Collectibles Market
Heritage Auctions sold a sealed Super Mario Bros. graded PSA 9.6 A++ for $3 million on June 12, 2026. Heritage called it a world record for a video game sold at auction.
| Game | Grade | Price | Sale date |
|---|---|---|---|
| Super Mario Bros. (NES, sealed, second production) | PSA 9.6 A++ | $3,000,000 | June 12, 2026 |
| The Legend of Zelda (NES, sealed, first production) | CGC 9.2 A | $375,000 | August 2024 |
| The Legend of Zelda (NES, sealed, first production) | CGC 9.4 A+ | $300,000 | May 2025 |
| Pokemon Blue Version (Game Boy, sealed) | CGC 9.8 A++ | $106,250 | May 2025 |
Source: Heritage Auctions sale results, reported by Heritage Intelligent Collector and CGC Video Games, August 2024 to June 2026
The Mario sale beat the previous $2 million record, set in a 2021 private sale, by $1 million.
Heritage reported more than $1.41 billion in total sales across all categories through June 30, 2026, its highest mid-year total.
Source: Heritage Auctions, Intelligent Collector, June and July 2026
Publishers revisit the same era with new releases, tracked in these video game remakes and remasters statistics.
Pokemon TCG Pocket Revenue After Two Years
Pokemon TCG Pocket earned $975.2 million in net revenue on Google Play and the App Store in its first two years. Japan led spending.
Year one brought $741.4 million. Year two brought $233.7 million, a 68% decline.
The estimates exclude the game’s web shop. Pocket ranks 30th among top-grossing mobile games for 2026, down from 10th in 2025.
Source: PocketGamer.biz, citing AppMagic estimates, October 30, 2024 to late October 2026 (published November 2, 2026)
Gross player spending is a separate, higher measure. It passed $1.6 billion after 18 months, as of April 30, 2026.
Source: PocketGamer.biz, citing AppMagic estimates, April 30, 2026
FAQs
How big is the gaming collectibles market?
No firm sizes the whole category. Trading card games, its largest sized segment, are estimated at $15.11 billion for 2026 by Mordor Intelligence and $9.2 billion by Global Market Insights, under different scopes.
What is the most expensive video game ever sold?
A sealed Super Mario Bros. graded PSA 9.6 A++ sold for $3 million at Heritage Auctions on June 12, 2026. It beat the previous $2 million record from a 2021 private sale.
How many Pokemon cards are printed each year?
About 10 billion were printed between April 2025 and March 2026, per The Pokemon Company. Lifetime production passed 85 billion cards as of March 31, 2026.
How much money does Magic: The Gathering make?
Hasbro reported $616.1 million in Magic: The Gathering revenue for Q3 2026 and $1,630.9 million for the first nine months of 2026. Both figures rose 34% year over year.
Can Reddit threads tell you the gaming collectibles market size?
No. Reddit posts are anecdotal, not sized datasets. For 2026 trading card game revenue, Mordor Intelligence estimates $15.11 billion and Global Market Insights $9.2 billion.