
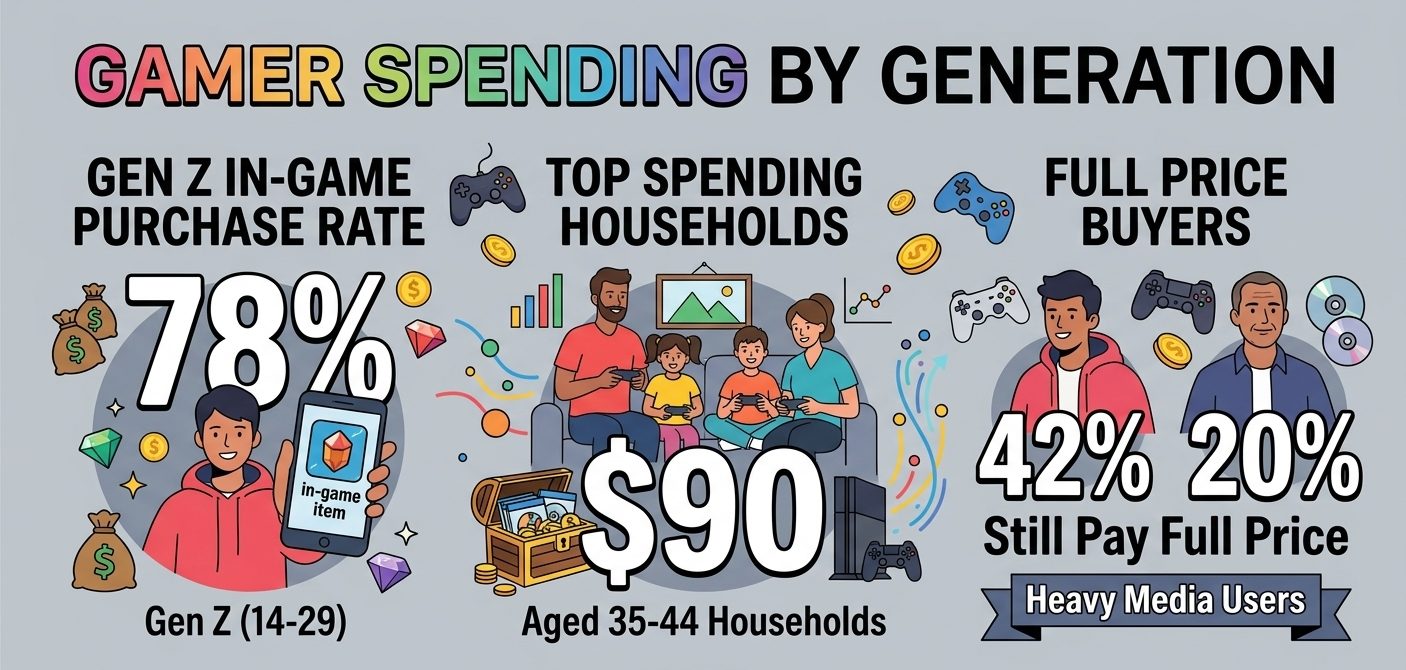
Gen Z players buy in-game content at a 78% rate in the ESA’s 2026 survey. Households headed by 35-to-44-year-olds, meanwhile, spent the most on game software and hardware in 2024, at $90. These gamer spending by generation statistics set purchase rates, household dollars, full-price buying and the 2025 Gen Z pullback side by side, naming the measurement and period behind each figure.
Gamer Spending by Generation Statistics
Which Generation Spends the Most on Video Games?
Households headed by someone aged 35 to 44 spent $90 on video game software and hardware in 2024, based on a Motley Fool Money analysis of the BLS Consumer Expenditure Survey.
The under-25 bracket followed at $89. Spending drops to $49 for ages 45 to 54 and $6 for 65 and older.
Every bracket except 65 and older spent less than in 2023. Motley Fool Money puts the 45-to-54 decline at 43%, the steepest of any bracket.
The data is per household, sorted by the age of the person who owns or rents the home. Age bands do not map exactly onto generations, and this table excludes online gaming services.
| Age of reference person | 2023 | 2024 |
|---|---|---|
| Under 25 | 91 | 89 |
| 25 to 34 | 96 | 74 |
| 35 to 44 | 102 | 90 |
| 45 to 54 | 86 | 49 |
| 55 to 64 | 27 | 16 |
| 65 and older | 5 | 6 |
Source: Motley Fool Money analysis of BLS Consumer Expenditure Survey data, calendar years 2023 and 2024 (video game software and hardware only)
Counting online gaming services too, the average US household spent $55 on video games in 2024, down from $69 in 2023.
Source: Motley Fool Money analysis of BLS Consumer Expenditure Survey data, 2023 and 2024
Gamer Spending by Generation on In-Game Content
78% of Gen Z players, aged 14 to 29, have purchased in-game content, per the ESA’s 2026 Essential Facts report. Gen Alpha (5 to 13) follows at 69%, and Millennials (30 to 45) at 67%.
Buyers typically spend $20 a month, a median figure ESA reports across the three groups. Platform-level detail sits in these in-game purchase spending habit figures.
The ESA release lists purchase rates only for these three generations. It does not publish Gen X or Boomer rates.
Across all players, 58% downloaded a free game in the past 12 months, 43% bought a game, 35% bought a subscription and 19% borrowed one. Respondents could pick several routes, so these shares overlap.
Source: ESA, 2026 Essential Facts About the U.S. Video Game Industry (YouGov online panel survey, February 11–25, 2026, 13,545 respondents)
How Many Players in Each Generation Play Weekly?
The same survey counts Americans who play one or more hours a week. Weekly play falls with each older generation.
| Generation | Age range (ESA) | Play 1+ hours weekly |
|---|---|---|
| Gen Alpha | 5 to 13 | More than 80% |
| Gen Z | 14 to 29 | More than 80% |
| Millennials | 30 to 45 | 71% |
| Gen X | 45 to 61 | 56% |
| Boomers | 62 to 80 | 50% |
| Silent Generation | 81 to 90 | 32% |
Source: ESA, 2026 Essential Facts About the U.S. Video Game Industry, survey fielded February 2026
In total, 212.3 million Americans play every week, up 7.2 million from 2025. The average player is 37.
Source: ESA, 2026 Essential Facts About the U.S. Video Game Industry
42% of Gen Z vs 20% of Gen X Still Pay Full Price
IGN Entertainment’s Generations in Play 2026 report found 62% of surveyed heavy media consumers no longer regularly buy full-price games.
By generation, 42% of Gen Z (14 to 29) and 38% of Millennials (30 to 44) said they still buy at full price. Only 20% of Gen X (46 to 61) said the same.
Kantar and UC Berkeley surveyed 6,250 people in the US, UK and Australia. Respondents qualified on heavy media use, so results describe engaged players, not the general population.
Christopher Dring of The Games Business told VGC that older players’ habits may reflect having less time and more money, rather than a pure generational shift.
Source: IGN Entertainment, Generations in Play 2026 Audience Insights Report (with Kantar and UC Berkeley), published April 2026
Is Gen Z Spending Less on Games? What Circana’s 2025 Data Shows
Video game spending by US consumers aged 18 to 24 fell nearly 25% year over year in early 2025, based on Circana data reported by The Wall Street Journal in June 2025.
The same age group cut spending across all tracked retail categories by 13% from January to April 2025. Declines in game spending among older age groups stayed under 5%.
Circana analyst Mat Piscatella pointed to a tougher job market for young graduates. Play time and platform data for the cohort appear in these Gen Z gaming habits figures.
ESA’s 2026 survey still shows 78% of Gen Z players buying in-game content. The two measure different things: Circana tracks dollars spent, while ESA records whether players report buying.
Source: Circana data via The Wall Street Journal, January–April 2025 vs the same period in 2024
For Gen Alpha, Gamer Spending by Generation Runs Through Parents
Among US parents, 54% buy in-game content for their children, according to ESA’s 2026 report. Of those, 93% require approval for purchases their kids make.
Gen Alpha players report a 69% in-game purchase rate in the same survey. The parent and player figures come from different respondent groups, so they are not directly comparable.
Three in four American parents (75%) play video games each week. Of those, 81% say they also game with their children.
Two-thirds of parents use parental controls, rising to 70% for parents of kids aged 12 and under.
Source: ESA, 2026 Essential Facts About the U.S. Video Game Industry, survey fielded February 2026
How Does Gamer Spending by Generation Fit the $60.7 Billion US Market?
| Category | 2024 | 2025 |
|---|---|---|
| Content | 51.7billion | 52.3 billion |
| Hardware | 4.9billion | 5.4 billion |
| Accessories | 3.2billion | 2.95 billion |
| Total | 59.9billion | 60.7 billion |
Source: ESA, Circana and Sensor Tower, calendar years 2024 and 2025 (released February 11, 2026)
US consumers spent $60.7 billion on video games in 2025, up 1.4% from 2024. Content made up $52.3 billion of that total.
Subscription spending grew 20% in 2025, the main content driver ESA cites. Pricing for individual games sits in these MMO subscription statistics.
Hardware rose 9% to $5.4 billion, while accessories fell 7%. Software sold per console is tracked in console game attach rate data.
Mobile game spending reached $26.7 billion in 2025, per Sensor Tower. Store-level totals appear in these app store gaming revenue figures.
Battlefield 6 was the top-grossing console and PC full game in the US in 2025. MONOPOLY GO! led mobile.
Circana and Sensor Tower restated the figures in March 2026. Revised 2025 totals are $60.8 billion overall, $52.4 billion for content and $2.9 billion for accessories.
Source: ESA, Circana and Sensor Tower, calendar year 2025 (revision noted March 2026)
Circana projects US spending will rise 3% to $62.8 billion in 2026. That would top the 2021 record of $61.7 billion.
Source: Circana, 2026 forecast published February 11, 2026
FAQs
Which generation spends the most money on video games?
Households headed by 35-to-44-year-olds spent the most on game software and hardware in 2024, at $90, per a Motley Fool Money analysis of BLS data. Among players, Gen Z has the highest in-game purchase rate ESA reports, at 78%.
How much does Gen Z spend on games each month?
Players who buy in-game content typically spend $20 a month, the median ESA reports for Gen Alpha, Gen Z and Millennial buyers in its 2026 survey. 78% of Gen Z players have bought in-game content.
Do Gen Z gamers still buy games at full price?
Yes, more often than older cohorts. IGN’s 2026 Generations in Play survey found 42% of Gen Z respondents still buy at full price, against 38% of Millennials and 20% of Gen X. Respondents were heavy media consumers.
Has Reddit discussed the latest generational gaming data?
It has. Variety’s June 2026 coverage of the ESA Essential Facts report was posted to r/Games. Reddit threads reflect opinion; the ESA’s YouGov survey of 13,545 respondents is the underlying data source.
How much did Americans spend on video games in 2025?
US consumers spent $60.7 billion, up 1.4% from 2024, per ESA, Circana and Sensor Tower. A March 2026 restatement revised the total to $60.8 billion. Circana forecasts $62.8 billion for 2026.
Citations
https://www.circana.com/post/circana-forecasts-a-transformative-year-for-video-games-in-2026
https://www.fool.com/money/research/video-game-spending-statistics/