
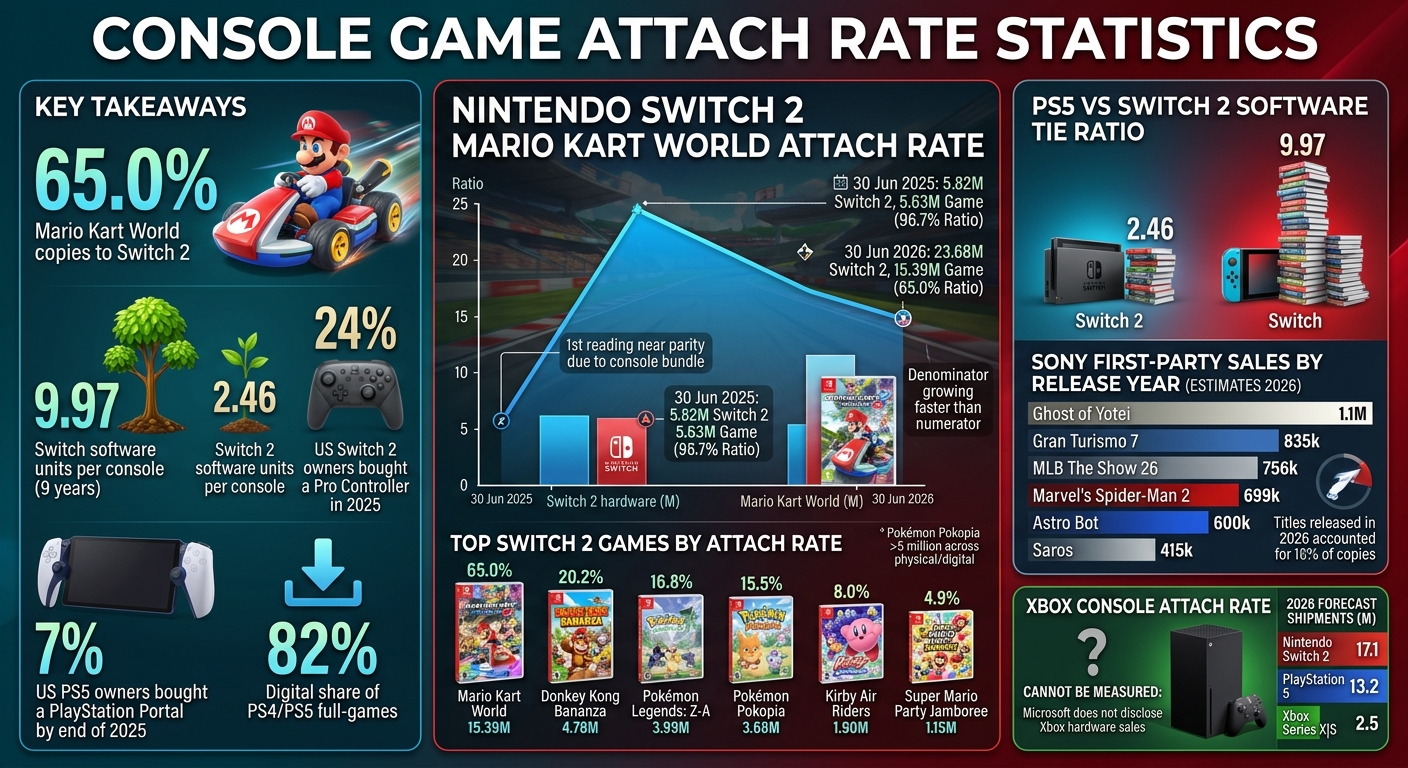
Mario Kart World had sold 15.39 million copies against 23.68 million Nintendo Switch 2 consoles as of June 30, 2026, a ratio of 65.0% on Nintendo’s own unit figures. Twelve months earlier the same two numbers gave 96.7%. This post covers console game attach rate data for Switch 2 and PlayStation 5, platform tie ratios, US accessory rates and why the Xbox figure has no denominator.
Console Game Attach Rate
How Is The Console Game Attach Rate Calculated?
Attach rate divides copies of one title by consoles sold on the same date. Nintendo publishes both numbers every quarter and does not publish the ratio itself, so every percentage below is that division stated openly.
Two footnotes on Nintendo’s page change how the figures read. Software units include copies bundled with hardware, and for Nintendo Switch 2 Edition titles only the packaged version counts toward Switch 2 software, with downloads counted under Switch.
Tie ratio is the platform-level version: all software units divided by all hardware units. Nintendo reports consolidated unit sales while Sony reports sell-in to retail, so the two denominators are not built the same way and should not be read as one series.
Nintendo Switch 2 Console Game Attach Rate For Mario Kart World
Mario Kart World launched alongside the hardware on June 5, 2025 and was sold in a console bundle, which is why the first reading sits near parity. The rate has fallen every quarter since without the game ever stopping selling.
Between December 31, 2025 and June 30, 2026 the console added 6.31 million units while Mario Kart World added 1.36 million copies. The denominator is now growing faster than the numerator.
| Quarter end | Switch 2 hardware (M) | Mario Kart World (M) | Ratio |
|---|---|---|---|
| 30 Jun 2025 | 5.82 | 5.63 | 96.7% |
| 30 Sep 2025 | 10.36 | 9.57 | 92.4% |
| 31 Dec 2025 | 17.37 | 14.03 | 80.8% |
| 31 Mar 2026 | 19.86 | 14.70 | 74.0% |
| 30 Jun 2026 | 23.68 | 15.39 | 65.0% |
Source: Nintendo Co., Ltd. IR, Dedicated Video Game Sales Units and Top Selling Title Sales Units, quarter ends June 30, 2025 to June 30, 2026. Ratio is copies divided by consoles, both worldwide consolidated units life-to-date.
Which Switch 2 Games Have The Highest Console Game Attach Rate?
Nintendo lists six Switch 2 titles above one million units. The gap between first and second place is 10.61 million copies.
| Title | Units to 30 Jun 2026 (M) | Ratio to 23.68M consoles |
|---|---|---|
| Mario Kart World | 15.39 | 65.0% |
| Donkey Kong Bananza | 4.78 | 20.2% |
| Pokémon Legends: Z-A – Nintendo Switch 2 Edition | 3.99 | 16.8% |
| Pokémon Pokopia | 3.68 | 15.5% |
| Kirby Air Riders | 1.90 | 8.0% |
| Super Mario Party Jamboree – Nintendo Switch 2 Edition | 1.15 | 4.9% |
Source: Nintendo Co., Ltd. IR, Top Selling Title Sales Units, as of June 30, 2026. The two Nintendo Switch 2 Edition lines count packaged copies only.
One line has moved since that cut-off. Nintendo and The Pokémon Company announced on August 14, 2026 that Pokémon Pokopia had passed 5 million units across physical and digital versions, up from 3.68 million at the end of June. Nintendo has not published a matching hardware figure for August, so the ratio for that milestone cannot be stated. Wider platform context sits in these Nintendo sales and revenue figures.
Switch 2 Vs Switch Software Tie Ratio
Switch 2 added 0.97 games per console over its first twelve months, then stalled: the ratio moved less than 0.01 between March and June 2026 as hardware and software grew at almost the same pace.
| Platform and date | Hardware (M) | Software (M) | Tie ratio |
|---|---|---|---|
| Switch 2, 30 Jun 2025 | 5.82 | 8.67 | 1.49 |
| Switch 2, 30 Sep 2025 | 10.36 | 20.62 | 1.99 |
| Switch 2, 31 Dec 2025 | 17.37 | 37.93 | 2.18 |
| Switch 2, 31 Mar 2026 | 19.86 | 48.71 | 2.45 |
| Switch 2, 30 Jun 2026 | 23.68 | 58.17 | 2.46 |
| Switch, 30 Jun 2026 | 156.59 | 1,561.95 | 9.97 |
Source: Nintendo Co., Ltd. IR, Dedicated Video Game Sales Units, June 30, 2025 to June 30, 2026. Tie ratio is software units divided by hardware units on the same date.
The older machine is still the bigger software market. Details on that install base are in these Nintendo Switch platform statistics, and the resale channel that sits outside these counts is covered in this second-hand games market breakdown.
PlayStation 5 Console Game Attach Rate: What Sony Publishes
Sony does not publish cumulative per-title sales, so no PS5 attach rate can be built the way Nintendo’s can. What Sony does publish is quarterly sell-in for hardware and software.
PS5 sell-in reached 1.6 million units in April to June 2026, against 2.5 million a year earlier. Cumulative sell-in passed 95 million units by June 30, 2026.
| Quarter | PS5 hardware (M) | PS4 and PS5 software (M) | Digital share |
|---|---|---|---|
| Q1 FY2025 (Apr–Jun 2025) | 2.5 | 65.9 | 83% |
| Q2 FY2025 (Jul–Sep 2025) | 4.0 | 80.3 | 72% |
| Q3 FY2025 (Oct–Dec 2025) | 7.9 | 97.2 | 76% |
| Q4 FY2025 (Jan–Mar 2026) | 1.5 | 74.6 | 85% |
| Q1 FY2026 (Apr–Jun 2026) | 1.6 | 66.1 | 82% |
Source: Sony Interactive Entertainment, Business Data & Sales, as of June 30, 2026, and Sony Group Corporation quarterly earnings disclosures. Units are sell-in to retail; digital share is a unit share of full-game software.
Software units cover both PS4 and PS5 and include copies bundled with consoles, so they cannot be divided by the PS5 base alone. The download split is tracked further in these PlayStation Store digital sales statistics, and segment revenue in these Sony Interactive Entertainment figures.
Sony First-Party Sales By Release Year In 2026
Alinea Analytics estimated on June 18, 2026 that PlayStation had sold around 10 million first- and second-party copies across PS5 and PS4 since the start of the year, drawn from 198 games. Titles released in 2026 accounted for 16% of those copies.
| Title | Copies in 2026 (estimate) | Launch year |
|---|---|---|
| Ghost of Yotei | 1,100,000 | 2025 |
| Gran Turismo 7 | 835,000 | 2022 |
| MLB The Show 26 | 756,000 | 2026 |
| Marvel’s Spider-Man 2 | 699,000 | 2023 |
| Astro Bot | 600,000 | 2024 |
| Saros | 415,000 | 2026 |
Source: Alinea Analytics, sold-through estimates for PlayStation, January 1 to June 18, 2026. MLB The Show 26 and Saros figures are lifetime to that date. These are the firm’s estimates, not Sony disclosures.
Why The Xbox Console Game Attach Rate Cannot Be Measured
Microsoft no longer discloses Xbox hardware unit sales, which removes the denominator the calculation needs. The nearest public figures are forecasts.
S&P Global Market Intelligence Kagan, in a forecast compiled in July 2026, puts Xbox Series X|S at 2.5 million shipments for calendar 2026, down from an estimated 3.2 million in 2025. It expects the three-platform market to fall 19.5% to 33.9 million units.
| Platform | 2026 forecast shipments (M) |
|---|---|
| Nintendo Switch 2 | 17.1 |
| PlayStation 5 | 13.2 |
| Xbox Series X|S | 2.5 |
Source: S&P Global Market Intelligence Kagan console shipment forecast, compiled July 2026, home consoles from Microsoft, Nintendo and Sony only.
Christopher Dring of The Game Business said on June 28, 2026 that a new AAA single-player console game tends to take 75% to 80% of its launch sales on PlayStation rather than Xbox, a global split he drew from GSD and Ampere Analysis data and described as lower for online multiplayer titles. Platform-level counts appear in these Xbox hardware and Game Pass statistics. Subscription downloads complicate the picture further, since access is not a sale, as shown in this subscription adoption data.
Console Accessory Attach Rate In The US
The same division applies to peripherals. Circana analyst Mat Piscatella reported in January 2026 that the Switch 2 Pro Controller was the best-selling US accessory of 2025 in units and dollars, at a 24% attach rate to Switch 2 hardware.
| Accessory | US attach rate | Period |
|---|---|---|
| Switch 2 Pro Controller | 32% | June 2025, launch month |
| Switch 2 Pro Controller | 24% | Full-year 2025 |
| PlayStation Portal | 7% | Lifetime to end of 2025 |
Source: Circana, reported by Mat Piscatella, June 2025 and January 2026. Each rate is measured against that accessory’s own US console base.
A 24% controller rate on hardware that had been on sale for seven months sits against 7% for the PlayStation Portal on a base five years old. What owners spend after the console purchase is covered in these in-game purchase spending habits, and the platform revenue split in this mobile versus console comparison.
FAQs
What is the console game attach rate for Mario Kart World?
65.0% as of June 30, 2026: 15.39 million copies against 23.68 million Switch 2 consoles, both from Nintendo. The figure includes copies bundled with hardware, and it was 96.7% a year earlier.
Which Switch 2 game ranks second on attach rate?
Donkey Kong Bananza, at 4.78 million copies against 23.68 million consoles on June 30, 2026, or 20.2%. Pokémon Pokopia sat at 3.68 million on that date and passed 5 million in August 2026.
Are the console game attach rate figures posted on Reddit reliable?
The unit counts behind them are. They trace to Nintendo’s quarterly IR pages, which publish hardware and software units but never the ratio, so the percentage itself is always someone’s division.
Does Reddit have PS5 attach rate data for individual games?
No. Sony publishes cumulative shipments and quarterly software units, not per-title sales, so any PS5 attach rate circulating on Reddit is a third-party estimate rather than a company figure.
What is the Switch 2 software tie ratio?
2.46 games per console on June 30, 2026, from 58.17 million software units and 23.68 million consoles. The original Switch stands at 9.97 after nine years on sale.