
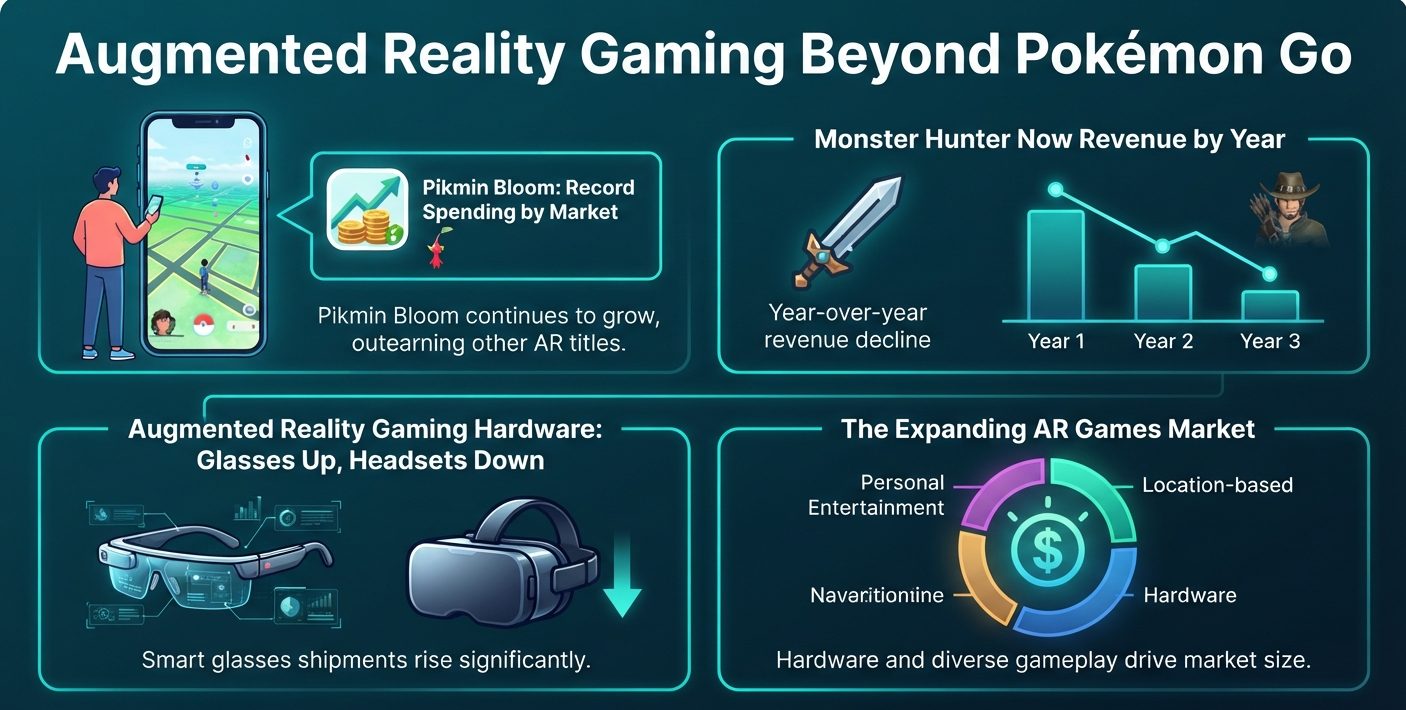
Pokémon GO made $141.5 million on the App Store and Google Play in July 2026, its best month since June 2022, based on AppMagic estimates. This augmented reality gaming breakdown looks past that one title: what Monster Hunter Now and Pikmin Bloom earn, how glasses are overtaking headsets in shipments, and how far apart the 2026 market-size estimates sit.
Augmented Reality Gaming Statistics: Key Figures
Which AR Games Make Money Besides Pokémon GO?
Scopely Explore now runs Pokémon GO, Monster Hunter Now and Pikmin Bloom. All three came over in Scopely’s $3.5 billion purchase of Niantic’s games business in 2025, one of several large game studio buyouts tracked that year.
Source: PocketGamer.biz, November 2026
Monster Hunter Now Revenue by Year
Monster Hunter Now generated $336.9 million on Google Play and the App Store between its September 14, 2023 launch and its third anniversary. Year one brought in $219.7 million, or 60% of the total.
Spending fell 69% to $67.3 million in year two. It dropped another 26% to $49.9 million in year three.
Japan supplied 68% of year-three spending, a rising share. High spend per player in Japan also shows up in gacha game spending surveys of young Japanese adults.
Source: AppMagic estimates via PocketGamer.biz, September 2023 to September 2026 (Google Play and App Store only, web shop excluded)
Pikmin Bloom Spending by Market
Pikmin Bloom has earned $97.1 million in net player spending since its October 2021 launch. Its fifth year brought a record $36.1 million, 37% of lifetime earnings and 53% more than year four.
Taiwan drove the jump. Players there spent $13.7 million in year five, ahead of Japan’s $10.2 million.
| Market | Share of lifetime net spending |
|---|---|
| Japan | 49% |
| Taiwan | 18% |
| United States | 15% |
Source: AppMagic estimates via PocketGamer.biz, October 2021 to November 2026
Since February 2026, Pikmin Bloom has outearned Monster Hunter Now every month, nine months in a row. Its single best month was May 2026, at almost $4.7 million.
Peridot Closure Timeline
Niantic Spatial disabled Peridot’s in-app purchases on April 23, 2026 and pulled the app from stores on May 14. Servers closed on August 31, 2026, adding Peridot to a long list of game server shutdowns this year.
The franchise lives on outside phones: Hello, Dot runs on Meta Quest and Apple Vision Pro, and Peridot Beyond runs on Snap Spectacles.
Source: Niantic Spatial, Peridot mobile sunset notice, April 2026
Pokémon GO at 10: $141.5 Million in Its Anniversary Month
| Market | July 2026 spending | Share of global |
|---|---|---|
| United States | $50.1M | 35% |
| Japan | $38.9M | 27% |
| South Korea | $7.1M | 5% |
Source: AppMagic estimates via PocketGamer.biz, July 2026 (Google Play and App Store)
July 2026 spending rose 229% from June and put Pokémon GO fifth among mobile games that month. The game’s all-time monthly peak on these stores remains July 2021, at $182.7 million.
Apple users accounted for $90.4 million, or 64% of the month. The remaining $51.1 million came through Google Play.
Across the full decade, Sensor Tower estimates over $9 billion in app store revenue and more than 800 million downloads. The US alone contributed more than $3.6 billion and 145 million downloads.
Source: Sensor Tower, July 2016 to July 2026 (App Store and Google Play in-app purchase estimates)
Who Plays Pokémon GO?
Players aged 25 to 34 form the largest US age group, at 35%. In Japan, the 35 to 44 bracket leads at 30%, and 66% of users are male. Broader generational spending data shows how these age groups pay for games.
Japanese players also open the app more often. Sensor Tower measured an average open rate near 50% in Japan, against about 40% in the US.
Source: Sensor Tower Audience Insights, January 2022 to July 2026 (age and gender); January 2024 to July 2026 (open rate)
Augmented Reality Gaming Hardware: Glasses Up, Headsets Down
AR smart glasses shipments rose 98% in 2025, a record year, according to Counterpoint Research. Second-half shipments grew 148% year over year.
Waveguide glasses went from 13% of AR glasses shipments in H2 2024 to 38% in H2 2025. In the video-centric segment, RayNeo, XREAL and VITURE held a combined 96% of H2 2025 shipments.
Source: Counterpoint Research, Global XR Model Shipments Tracker, H2 2024 to H2 2025 (shipment share)
IDC counted 44.4% growth in total XR device shipments in 2025. Meta held 72.2% of the market, yet its Quest headset shipments fell 42.3%, a decline that also shows in VR headset ownership figures.
XREAL took 2.3% of XR shipments with display glasses aimed at gamers. VITURE shipments rose 94.9%, while ByteDance’s fell 30.5%.
Source: IDC Worldwide Quarterly AR/VR Headset and Wearable Device Trackers, full-year 2025
Smart Glasses Shipment Share, Q1 2026
Smart glasses without displays shipped about 2.25 million units in Q1 2026, up 167% year over year. Display eyewear grew 86% over the same period.
Counterpoint puts Meta closer to 84% for Q1 2026, but it counts display-less glasses only. IDC’s 69.2% covers its combined smart glasses scope.
Source: IDC, Q1 2026 (shipment share); Counterpoint Research, Q1 2026 (display-less segment)
How Big Is the Augmented Reality Gaming Market?
Mordor Intelligence values the AR games market at $11.34 billion in 2025 and $13.85 billion in 2026. It projects $37.57 billion by 2031, a 22.15% CAGR from 2026.
The Business Research Company puts 2025 at $18.43 billion and 2026 at $23.83 billion, with $66.9 billion forecast for 2030 at a 29.4% CAGR. Its scope adds sales of headsets, AR glasses, wearables and consoles.
IMARC Group sits between the two at $17.9 billion for 2025 and forecasts $147.0 billion by 2034.
Source: Mordor Intelligence, September 2026 update; The Business Research Company, February 2026; IMARC Group, February 2026 (vendor revenue under each firm’s own scope)
AR Gaming Revenue Share by Segment, 2025
| Segment | Largest category | Share of 2025 revenue |
|---|---|---|
| Application | Personal/home entertainment | 69.20% |
| Game type | Location-based | 64.10% |
| Device | Mobile devices | 59.40% |
| Component | Hardware | 57.30% |
| Monetization | In-app purchases | 48.35% |
| Region | North America | 34.60% |
Source: Mordor Intelligence, Augmented Reality Games Market, 2025 data
Fastest-Growing AR Gaming Segments to 2031
In every segment, the fastest-growing category is a different one from the largest. Mixed-reality hybrid games lead at a 35.9% CAGR, while location-based games still hold almost two-thirds of revenue.
Source: Mordor Intelligence, forecast CAGR through 2031
5G, Mobile Spend and 2030 Forecasts for Augmented Reality Gaming
Mordor rates 5G-enabled smartphones as adding about 4.2 points to its AR games CAGR forecast. It scores fragmented content discovery at minus 1.4 points and treats these impacts as directional, not additive.
Ericsson counted 162 million new 5G subscriptions in Q1 2026, bringing the total to 3.1 billion. It forecasts 6.4 billion by the end of 2031. Low-latency networks are also a factor in cloud gaming adoption, which is tracked separately.
Source: Ericsson Mobility Report, June 2026 (Q1 2026 subscriptions, 2031 forecast)
Newzoo puts total games revenue at $201.6 billion in 2025, up 9.1%. Mobile, where most AR titles run, made $113.3 billion, up 10.7%. Mobile’s lead also appears in genre-level revenue and playtime data.
Source: Newzoo Global Games Market Report, 2025 data
IDC Device Forecasts, 2026 vs 2030
IDC forecasts 13.6 million display-less smart glasses in 2026, worth $5.1 billion, rising to 27.3 million by 2030. It expects average selling prices to fall from about $376 to about $229 over the same period.
Display glasses from vendors such as XREAL, VITURE and RayNeo have the steepest forecast, at a 41.9% unit CAGR. IDC expects glasses with displays to pass VR and MR headsets in shipment volume by 2027.
Source: IDC, June 2026 forecast (units, 2026 to 2030); IDC, March 2026
FAQs
What is the most successful augmented reality game?
Pokémon GO. Sensor Tower estimates over $9 billion in App Store and Google Play revenue from July 2016 to July 2026, plus more than 800 million downloads.
How big is the AR gaming market in 2026?
Estimates differ by scope. Mordor Intelligence puts 2026 at $13.85 billion. The Business Research Company puts it at $23.83 billion, using a scope that also counts headsets, glasses and consoles.
Is Monster Hunter Now still making money?
Yes, at a lower rate. AppMagic estimates $49.9 million in year three, down 26% from year two, for a three-year total of $336.9 million through September 2026.
Will smart glasses replace phones for AR games?
Not yet. Mobile devices held 59.40% of AR games revenue in 2025, per Mordor Intelligence. IDC expects display glasses to pass VR and MR headsets in shipments by 2027.
Why do Pokémon GO player counts quoted on Reddit differ?
They measure different things. Scopely cites 800 million lifetime players. Sensor Tower counts over 800 million downloads through July 2026. Niantic has cited over a billion downloads, while AppMagic tracked 710 million.
Sources
https://sensortower.com/ja/blog/pokemon-go-10th-anniversary-JP
https://www.pocketgamer.biz/pikmin-bloom-blossoms-in-fifth-year-with-record-36m/
https://www.quantumrun.com/consulting/virtual-reality-market/